Exclusive for Terrace Students
Methods PSMT Playbook
Acuity’s comprehensive guide to ace your IA1.
Introduction
Welcome to the PSMT playbook! My name is Lachy, and I graduated from Terrace in 2022. This guide comprises part of my project called Acuity. We mentor QCE students (like you!) and provide cutting-edge study support.
Your Methods IA1 is the very first test you face in Year 12. Strangely, it is also the first time you will ever complete a PSMT. Fortunately, I believe that these should be the easiest marks you will be able to access for Methods. Many students miss this golden opportunity.
This playbook will offer systems, structures, and resources. It won’t do the assignment for you. The ideas it gives you are only effective if you can implement them and dedicate consistent time to this task.
Let’s begin!

Structure
As a starting point, hopefully you’ve already seen the task sheet on Spire.
If you have, you’d know that there are three primary sections: formulate, solve, and evaluate. Rounding out the assignment is also an introduction and conclusion.
Within these sections, you have some flexibility. Ultimately, the fine-grained structure you choose is personal preference, but I would strongly recommend having some scaffold to work with. Below are my recommendations.
Now that we have a general structure in mind, let’s dive into the specific details for this assignment ↓
Formulate

Looking for a head-start? How about…
My curated source list and research for this exact task.
The actual observations and assumptions I used.
My exact roof model, with all accompanying functions.
Direct links to use, and edit, my full Desmos file for yourself.
Inspiration for a levelled-up roof model featuring more complex functions, also with full Desmos access.
Every page from my 20/20 IA1.
Solve
Hopefully, if you’ve been working the assignment in order—that is, noting some observations and assumptions before attempting to solve—you will have done a little bit of research into what roof designs might fit the task requirements, plus example roof designs that you enjoy for functional or aesthetic reasons.
At this stage, before touching Desmos, have a crack at drawing a roof simply with pen and paper, and without worrying about dimensions, functions, or constraints. Use any research you’ve done as inspiration here.
Ignore for now how your sketch will translate over to Desmos.
Get creative! Remember, you’ll need diversity in your roof shape to nail that “modern and aesthetically striking look”
On this note, consider what themes you could utilise to try and accomplish a unique design which specifically represents the Brisbane Olympics.
Could your shape incorporate something natively Australian? An allusion to QLD in some way? Perhaps an Olympic symbol?
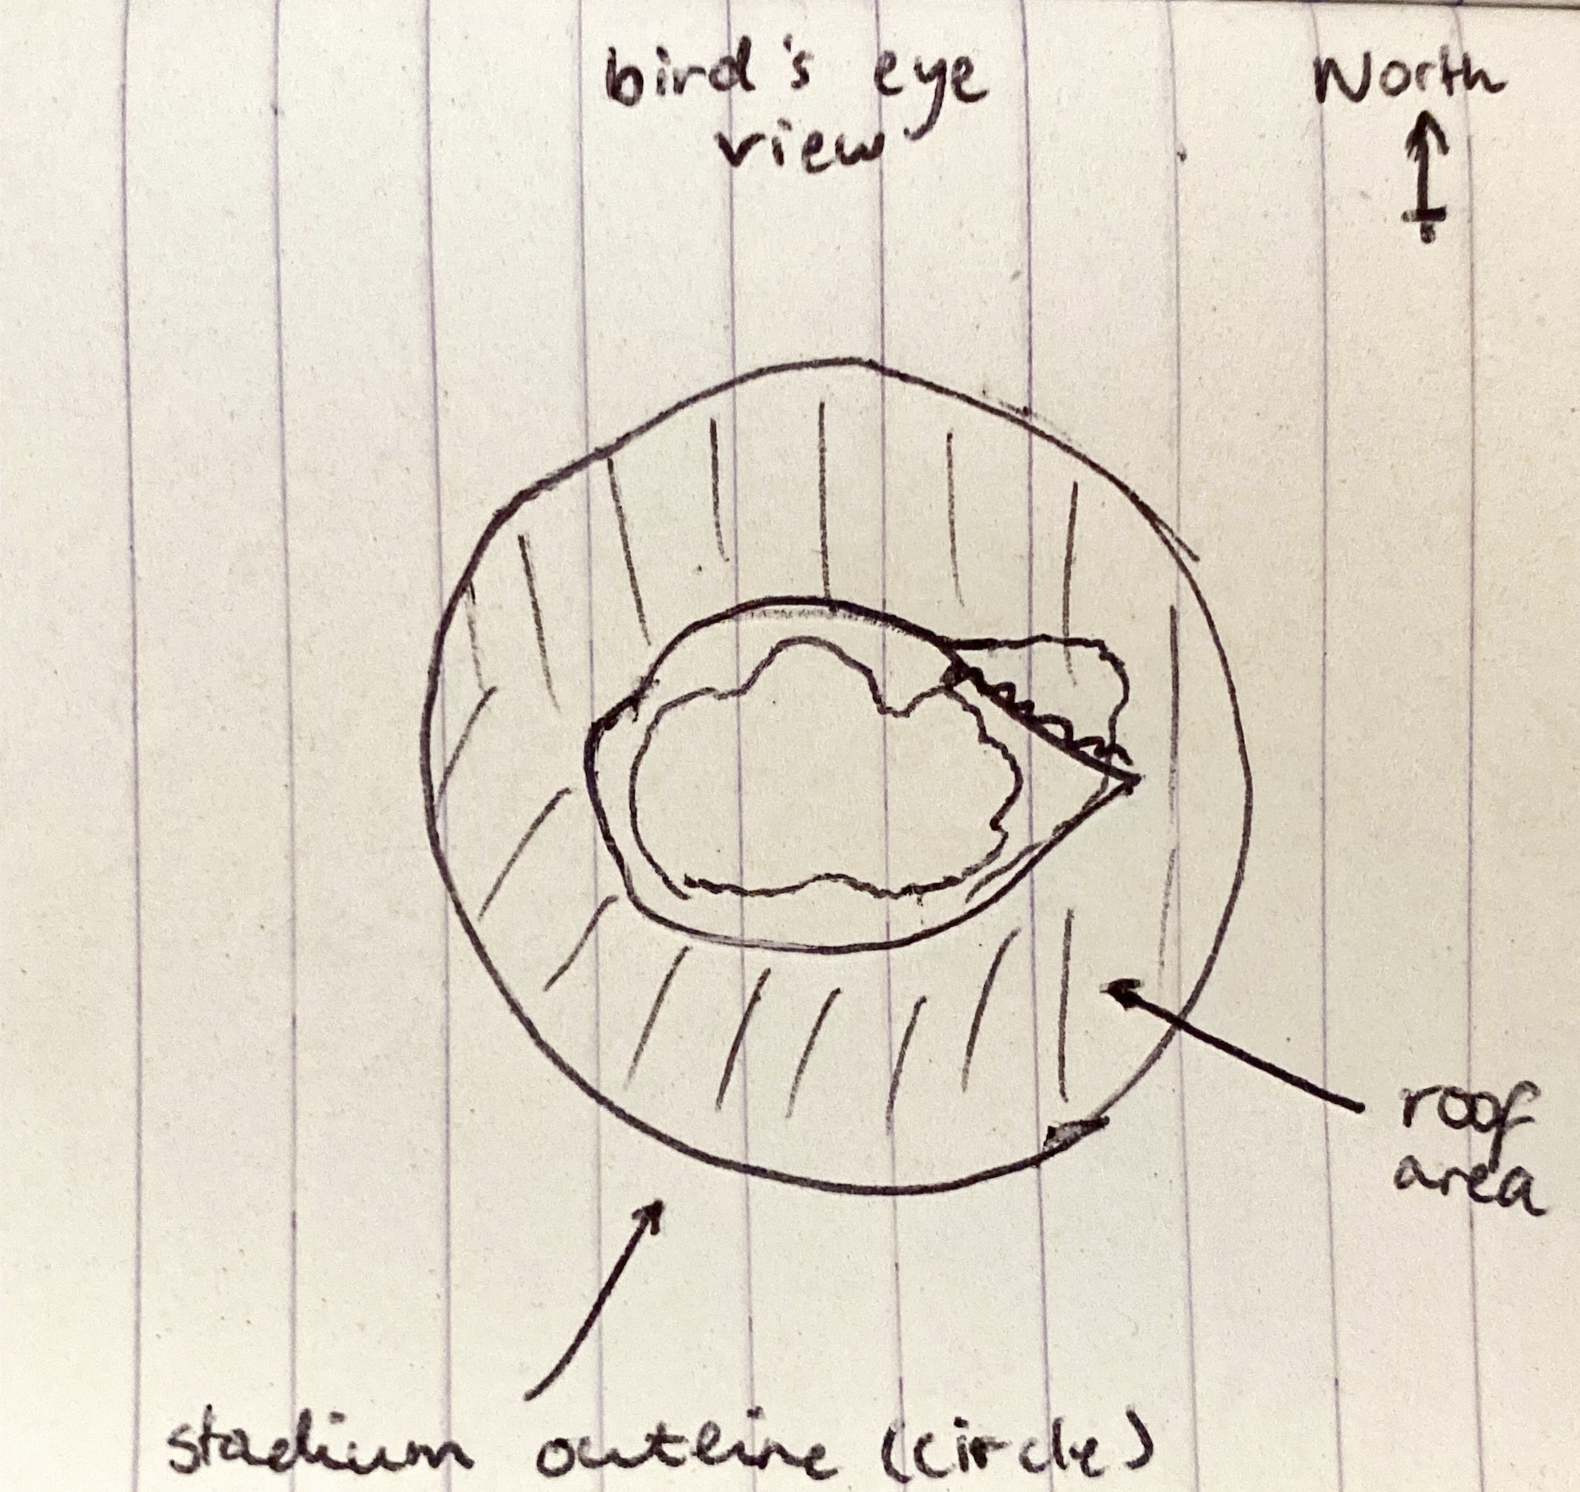
Here’s what I first came up with on the train (really bad):
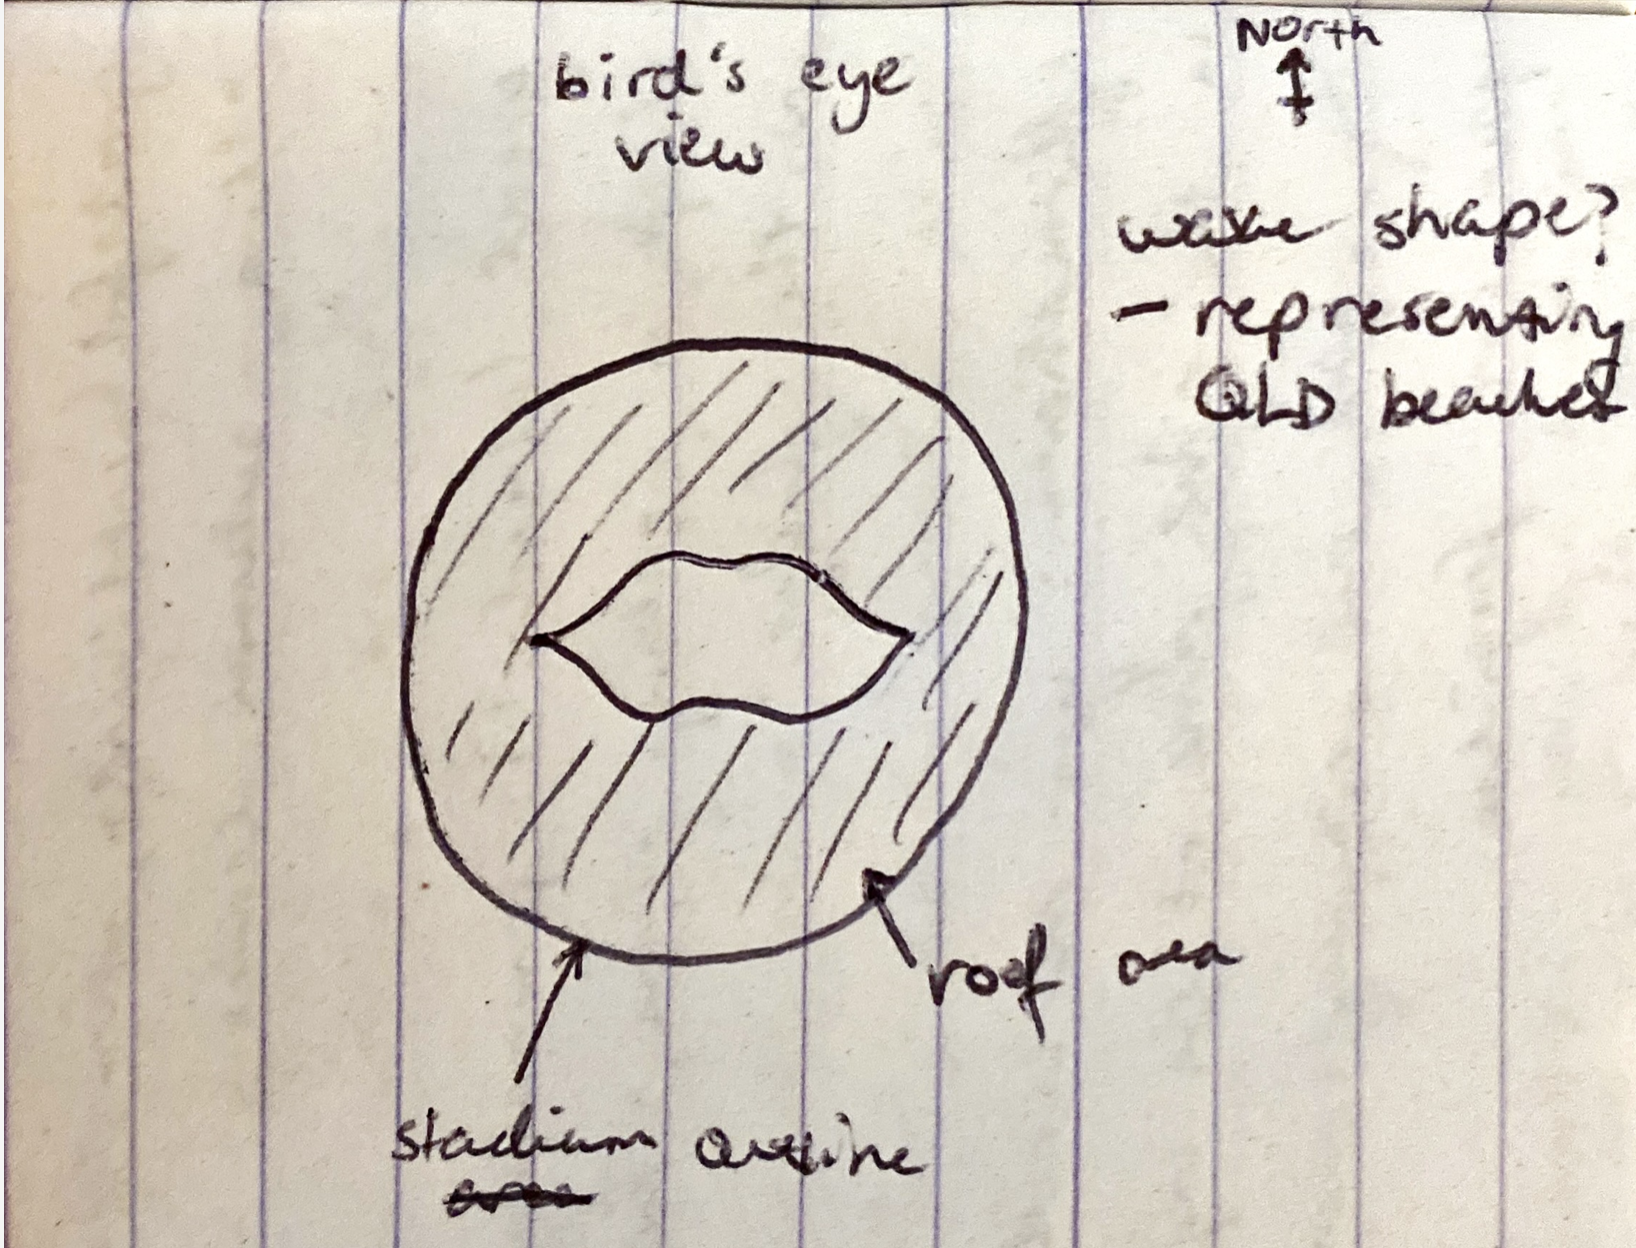
Then, I made it a little better, thinking about a wave-like design inspiration:
Take a look at your sketch or sketches.
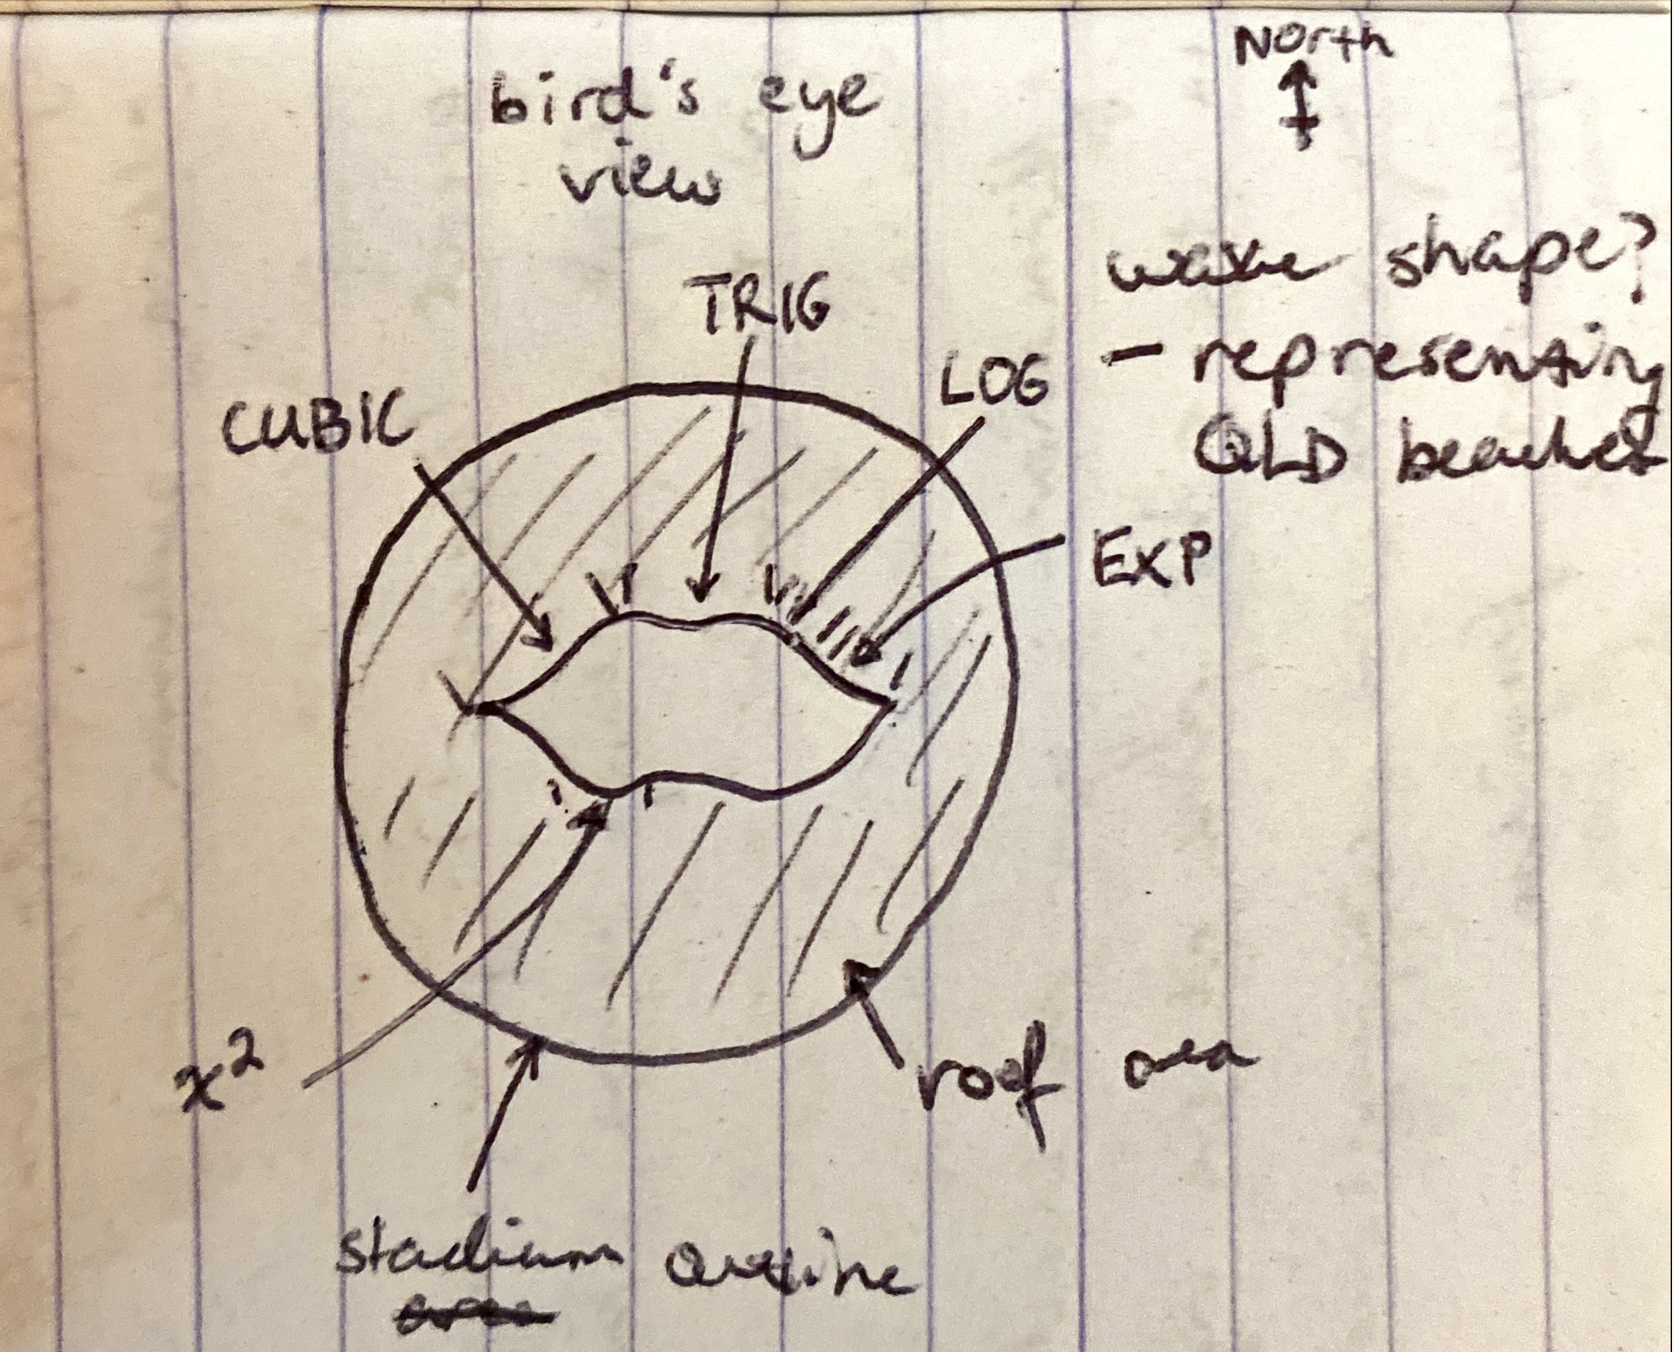
Working backwards, where could you see functions fitting in?
Remember, you can translate and transform functions in a lot of ways. Stretch out part of a sine wave and it can look similar to a parabola.
Which sections could lend themselves to less obvious functions, like logarithms or cubics?
Now, open Desmos. Create an account so that you can save your work!
What constraints are you under? How will you represent these (scale-wise) in Desmos?
Well, we know that the stadium uses a circular shape, with a 250m diameter. To get started in the simplest way, you can create a circle with a 1:1 scale to the task sheet. I’d recommend using a dashed line here to differentiate this border from later functions that you add.
If you choose to make the centre of your circle (and thus, the centre of your stadium) sit at the origin (0,0)—use this as an assumption!
One of the decisions I most strongly recommend in your IA1 is using sliders. By starting here, you can save yourself endless time and frustration whenever you want to tinker with your model. Rather than need to remember really precise numbers to get everything just right, you can automate it! Plus, you can link functions. As you move one, all the others can move with it, staying perfectly connected. I show you how to accomplish this specifically in a later section.
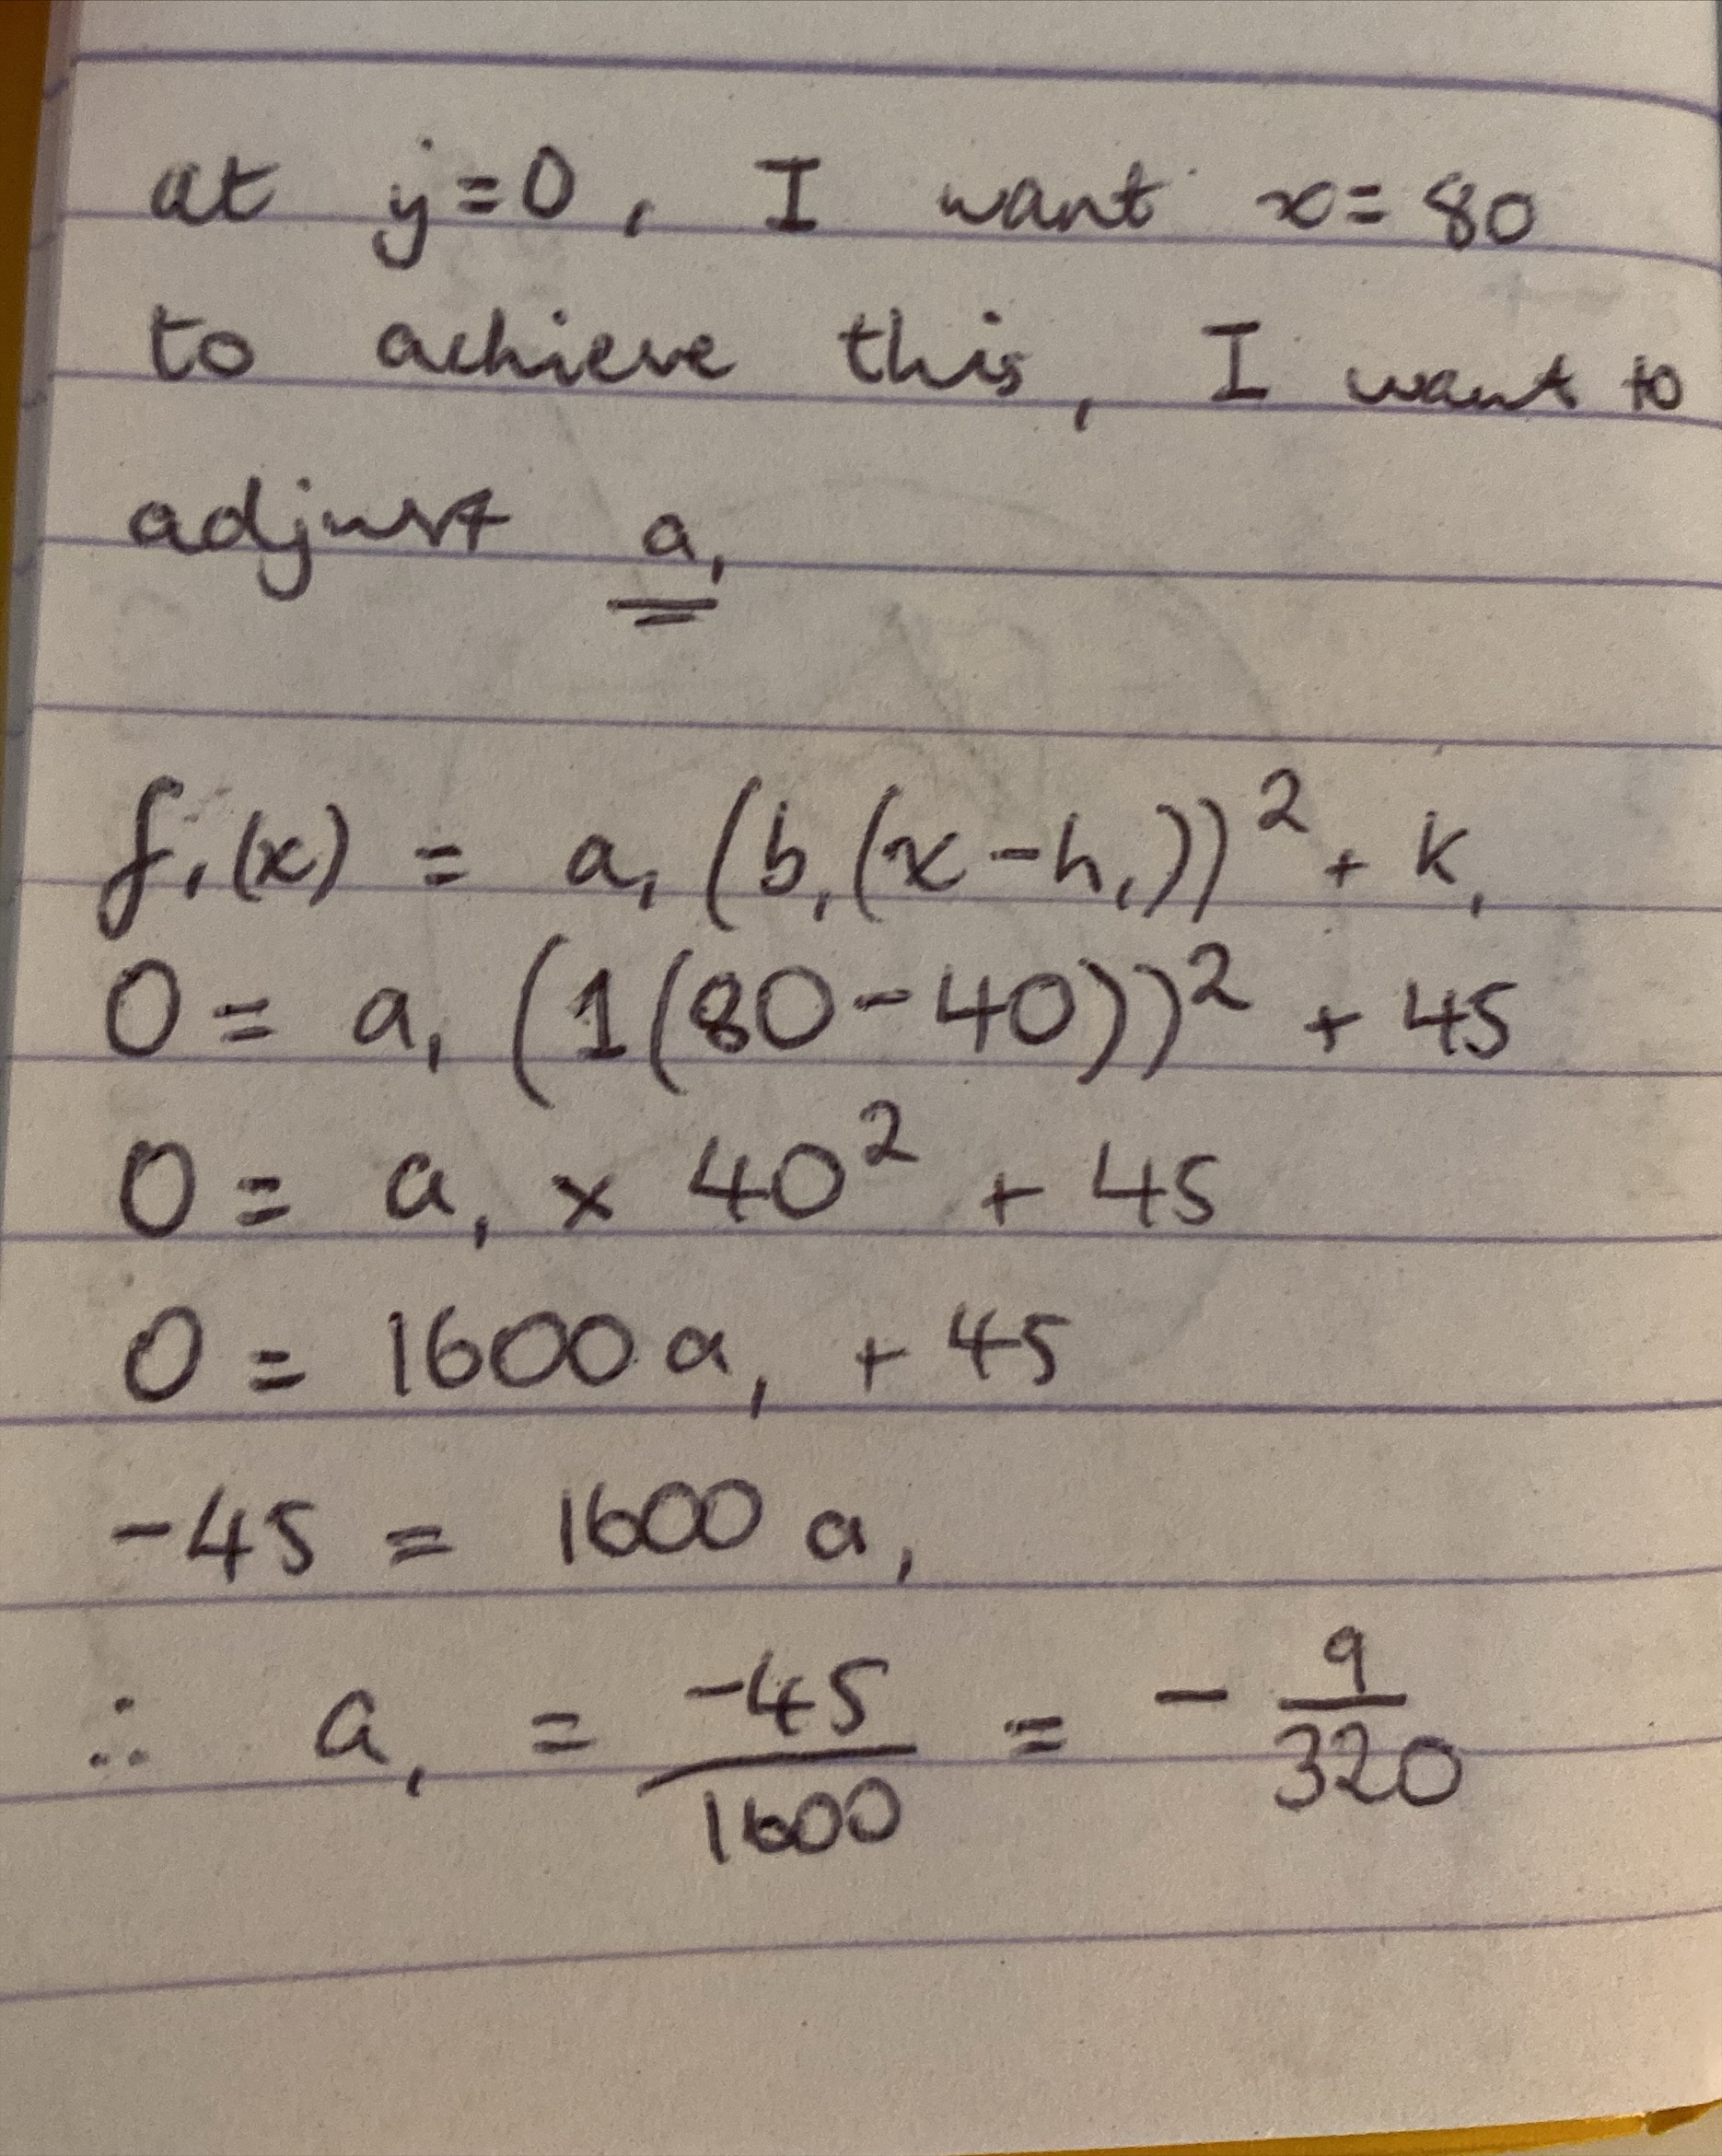
So, revisit the sketch you made. Which functions were you keen on using? Select a few and put them into Desmos now, in their general form only. Instead of numbers, use letters and add a slider. By doing this, you’ll be able to test exactly how each function shifts as you change the numbers, without having to guess.
Add each of the functions you’re considering for your design, so their structure is handy in Desmos. Hide individual functions if they’re in your way and you want to come back to them later. Colour-code them so that you can easily tell them apart.
Save your Desmos file!
At this point, you have a fair idea of the shape you’re trying to make (your sketch), and you know the tools at your disposal (the functions).
You might need to spend some time here just tinkering.
Adjust sliders. Move functions around.
Add more of the same type of function if needed.
Take functions away.
Essentially—try to mould the functions to the vision you had at the beginning.
If in doubt, simplify! Your model doesn’t need to be as complex as you might think, and you can always add in more complexity later on.
You can unmute this one:
To ace this assignment, you need to actually show that you’ve considered the Unit 3 calculus content that you’re being assessed on. Here is your opportunity.
So far, you’ve landed on your model through trial and error, plus maybe some algebra to connect functions at specific points. That’s absolutely fine!
Now, you’re going to make it mathematically watertight.
A key task sheet requirement was to calculate the area of your roof using integration techniques. Let’s start there (volume on!).
You’ve got the correct systems in place now, but does the maths stack up?
What area was the roof? Does this align with your assumptions, if applicable?
Do your functions continuously connect?
Depending on the expectations for your model as set up in your observations and assumptions, you may have other aspects of your design that would benefit from testing and verification. These are simply two examples.
At this stage, you enter a feedback loop.
If you’re happy with how your the design works, carry on to the next step.
If not, continuing tinkering and verifying until you’ve roughly got it.
If there are any glaring errors or numbers that don’t make sense), take a look through your integration, and the functions themselves, to see if you can spot them.
Make sure to save your Desmos file!
Consider the requirements of the task once more.
Your design might work mathematically, but how well does it align with the descriptives elements of the task sheet?
Are your assumptions reflected in the design?
How are the functional elements of this roof affected?
Have you considered weather effects? Natural lighting?
What did you note down in your observations that your model is currently missing?
Is it sufficiently “modern and aesthetically striking?”
Here is where the individuality of your model really shines through, and where you can differentiate yourself as a 20/20 candidate.
Should you make the roof symmetrical or asymmetrical? Why?
In light of your assumptions and observations, does the area of your roof feel appropriate? Why?
These are not questions for me to answer. How you make decisions here is up to you. There is no single correct answer. Importantly though, whatever you choose—make sure to justify that choice, ideally referring to observations you made.
Okay, so you’re happy with how your roof looks—brilliant!
Now, you have to convey the design choices you made via your report.
This is where a lot of students lose marks. Their model looks great, but they don’t explain why they made certain decisions.
So, think about (I’d recommend not doing this directly into your report) why you selected your functions, the specific shapes you gave those functions, the coordinates where you decided to connect them, and the area you settled on.
Even if there was no clear thought process or rationale at the time, you’re allowed to be a revisionist! With the clarity of hindsight, what could you have been thinking at the time? Why do those functions work now?
Your reasoning doesn’t need to be complex. Sometimes describing the aesthetics is completely valid.
An extremely valid justification definitely includes descriptions like “For the blue sine wave, I set my horizontal dilation factor to be 20, as I wanted a gently sloping function to form [section] of the roof, and I specifically selected a trigonometric function to impart a slight waviness that aligns with [intention]”
Or, “I chose 0.25 as the vertical translation for my parabola so that it would seamlessly connect with the yellow logarithmic function to its left, preventing any jagged edges that may take away from the desired modern aesthetic”
Now, present your model in the report!
More often than not, simple Desmos screenshots will suffice. Just check with your teacher first.
If you need to write in a function, use the dedicated function writing mode in MS Word. They’ll appear much cleaner in your write-up as a result.
In my opinion, the report flows best when you weave in your justification throughout the solution section.
Seeking inspiration for how to structure your report?
Of course, if your teacher has specific structural requirements for you, take those on board. They’re marking your assignment at the end of the day!
Finding this Useful?
We have a 1:1 tutoring program designed specifically for Year 12 Methods!
Evaluate
Overall, the evaluate section requires methodical and precise writing to collect full marks. Before starting on this section, make sure you go back and refine the observations and assumptions you made in the formulate component. You’ll definitely need to reference these here.
For me, I feel like the criteria sheet clearly outlines what your evaluate section should include:
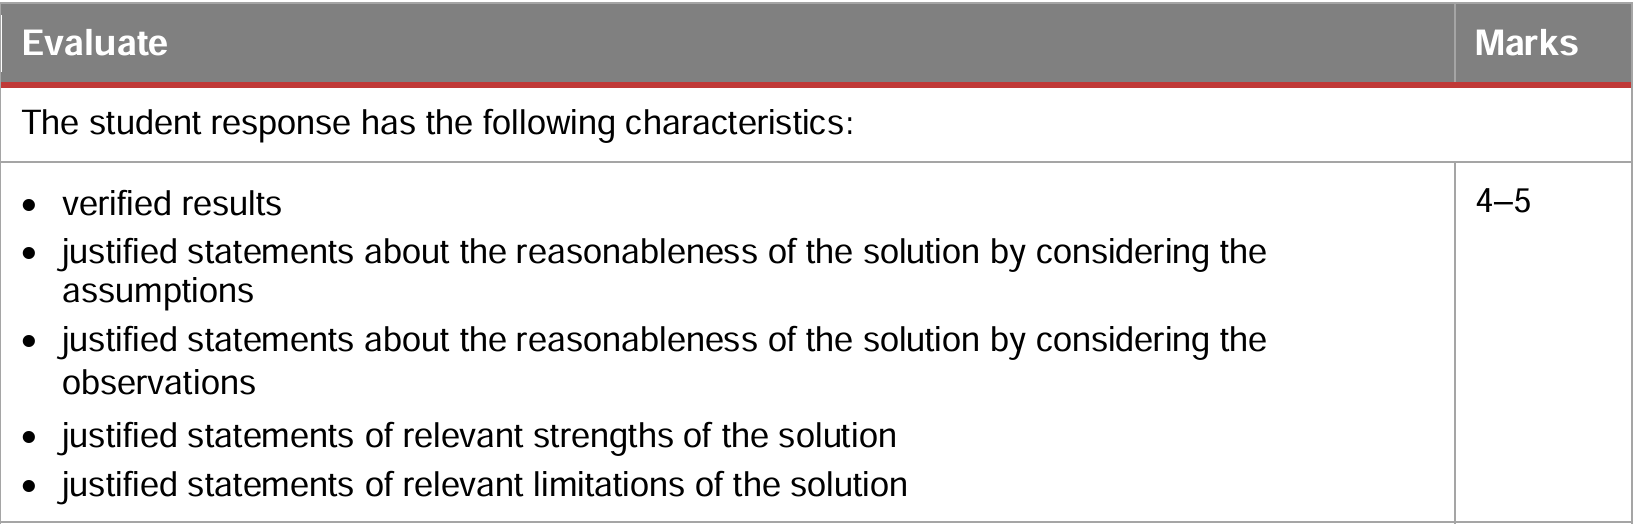
Although it doesn’t matter where you decide to place your verify results section, I generally prefer this at the end of the solve section, rather than in evaluate, as I feel like it flows on more cohesively from the heavy maths content there. In terms of fulfilling this criteria though, you can have it either in the solve or evaluate section.
Now, touching on the next four dot points. As outlined earlier, I think it makes a lot of sense to split your evaluate write-up into three short sections: reasonableness, strengths, and limitations. Under reasonableness, use two separate sub-paragraphs to distinguish clearly for the marker between your assumption and observation discussions.
Ultimately, the evaluate section will vary widely depending on the specifics of your model and the guiding assumptions you set out for yourself earlier in the assignment. Keep your writing to the point with these criteria in mind and you should score well here.
Use the structure and questions provided earlier as stimuli for getting started with this section.
Food for Thought: Limitations
To help you out, here are some quick areas I would consider exploring for your limitations:
- What materials would your roof be made out of? Would they allow light in? How heavy would they be? Would they be costly?
- Has your model fully encountered for possible weather events, like tropical storms?
- Does your end model actually align with your observations and assumptions? For example, I aimed to have ~50% of the stadium covered by the roof, but my initial model covered far more than this. As a result, the fans are sheltered, but what about natural lighting?
- Could you have incorporated more visually striking, more unique, elements?
- Is the concept of a circular stadium actually most realistic?
- In practice would the roof be flat (like in 2D here), or would it have a slope? What could the slope affect? Functionally? Aesthetically?
- Sustainability is a big point of emphasis in Olympic design? Could you consider that more closely in a re-do? Would solar panels, for instance, fit on top of the roof?
- How might specific sun angle effect shadows cast across the pitch? Would this influence the playing, viewing, and broadcasting experience?
These are just a few suggestions. Of course, when extrapolated to real life, your model won’t be perfect, but don’t chew up your word count listing off every conceivable limitation. If you need more ideas, return to the questions you asked whilst brainstorming your assumptions.
Completing the Report
Congratulations! If you’ve now completed the actual model, verified that it meets the task constraints, and then built cohesive formulate and evaluate sections around it, you’ve pretty much finished a rock-solid draft. Your job isn’t quite finished yet though.
As the finishing touches for your assignment, you’ll also need an introduction and conclusion. Collectively all these sections are really asking is for you to place your solution in context. Make the objective of your report clear, evaluate whether your model is reasonable based on the task constraints, and give a little insight into why this report could be relevant.
You don’t need to labour over these sections too much, but you can find clear guidelines for how I would approach them in the structure section above.

Final Advice and Resources
Here are just a few things I think deserve a little extra emphasis, plus some broader snippets of advice:
- Almost every criterion uses the word justified, meaning: show or prove something to be right, reasonable or valid.
- The more evidence you can use to support your decisions, the better.
- Really make an effort to take advantage of this assessment item. The rest of your marks throughout Year 12 Methods are significantly more difficult to acquire, so this assignment is a blessing for many students
- Collaborate with your peers. You won’t be offered much teacher-led feedback for this assignment, so drafting things with your peers can be a great idea. Brainstorming ideas for the model, in particular, can be really useful.
- Do not collude though! Your models can use similar mathematical concepts, but they, of course, cannot be the exact same thing.
- I know I have said this a few times, but please make sure you save your Desmos model…
Reminder! You can access my actual 20/20 assignment, two full Desmos templates with complete models, observations, assumptions, and so much more here.
What Next?
Through our Methods Mastery Program:
The Road Ahead
NOVEMBER
~Week 7: Submit your final PSMT report (20%)
January
Week 1: Year 12 begins for real.
March
~Week 10: Methods IA2 Exam (15%)
July
~Week 3: Methods IA3 Exam (15%)
OCTOBER
~Week 4: External Exam (50%)